Layering Smart Data Solutions
Analytics for Summer, Fall, Winter, Spring….
If you live in an area where the weather has distinguishable seasons, in your home there is one closet that is jammed with coats. Thick coats, thin coats, rain jackets, wool coats, pullovers, fleeces, wind breakers, etc. Why? Why not just one coat? Why not just one material? No mystery in the question, it is because each coat is designed to solve a particular problem. Is it windy? Then a windbreaker is ok. Is it windy and cold? Then maybe a windbreaker and a fleece. If it is frigid, you might wear a heavy wool coat. You know the drill and how to use the coat system. You wouldn’t wear a heavy wool coat in the middle of a hot summer just because it is raining. But this is what some try to do when they talk about analytics or AI/Machine Learning, they are searching for, or only have one coat for all analytical problems.
In manufacturing, the most successful analytics strategies are where layers of analytics exist. Analytical tools are right sized for the job. Interestingly, I am seeing a new trend where industrial companies are starting with a “heavy coat” approach to analytics. They are hiring data scientists and developing Big Data programs using traditional commercial technology stacks based on cloud NoSQL data stores and python or R programming languages, TensorFlow or Azure ML. These all require investments in data scientists and programmers. As a result, these companies are struggling to get returns from those investments. Don’t get me wrong, I believe companies should be investigating and investing in these types of solutions to solve large scale problems unique to their processes or organization. The mistake they are making is believing they only need one technology footprint for their analytics program. Just like coats, it is best to have a variety of options to choose from to right size the technology for the situation.
Big Data tools really shine when they are pulling data from billions of data sources with thousands or millions of events, anomalies, and event correlations to pull from. The insurance industry is a great application, i.e. actuaries based on people classifications, behaviors, past claims, geography, etc. From these datasets and analytical tools, data scientists can build models that predict expected future losses and thus determine insurance premiums based on desired margins. Another way these tools are used, is in marketing. By determining buying habits of individuals, marketers can position symbiotic products, or even the ideal time of day to position an advert to get the best results. In these traditional scenarios, data scientists have tons of data to pull from. They have tons of anomalies/events to classify.
In manufacturing, Big Data tools require special considerations. While the data set can be large, the data per asset is limited to maybe a few data points (columns in the analytics world). In manufacturing, downtime is costly and therefore, manufacturers are really good at staying running. These anomalies and events just don’t occur on a single asset at the frequency required to build great statistical models in a short time frame.
Another major challenge with traditional Big Data solutions in manufacturing is time lag. How do you correlate a quality event with product that was fed into the system two hours earlier? Or how do you correlate data entered into a quality system after test results are completed in the lab with production data captured in real-time? You might know what general time frame from the production order but largely these correlations require manual effort, time and energy on the part of the data scientist.
One last challenge is, once an Artificial Intelligence (AI)/Machine Learning (ML) model is built, how do you operationalize it? When I say operationalize it, how do you use that model to give real-time alerts, indications, warnings, predictions, etc.? All of these solutions are geared towards running inside of an IDE/GUI of software development tools like Jupyter, RStudio, Visual Studio, etc. Many times, these data models developed by the data scientists exist only on their laptop and are run asynchronous to the process they are modeling. Data Scientists are exporting data, cleaning data (which is 90% of the work) and then running the model and recording the results manually.
“Smart Data Solutions are the key” – Michael Gilsinger, Arauco
All this to say, the big heavy coat isn’t always the right answer when creating an analytics program for a manufacturing enterprise. There are most certainly insights to be gained via traditional Big Data tools but inevitably the realization comes that a more simplified, less costly, and more deployable approach is required for a large majority of the problems found in the real-time industrial environment. On top of that, analytics technologies need to be easily operationalized so that the organization quickly sees an ROI from its investments. One of our clients, Michael Gilsinger from Arauco, describes these smaller more agile solutions as “Smart Data Solutions.” I couldn’t have agreed more. Smart Data solutions are ones where actionable insights are gained and then operationalized with much less overhead and effort than a traditional Big Data solution.
Several years back, Gartner published a graphic called the Analytics Maturity Model where it defined the levels of maturity of an organization. I do not believe this should be called a maturity model. I agree with the definitions of each phase/level but not the context of maturity. If you haven’t seen it, the maturity model is made up of these four categories:
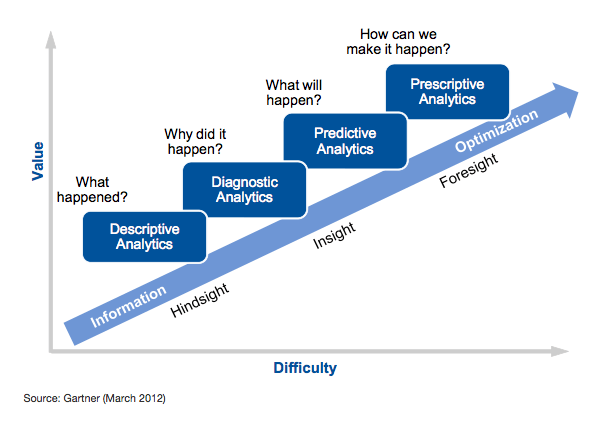
I prefer to see these not as maturity levels but more like layers of coats, each best suited for a different problem or situation. This is your coat closet. Each problem in a manufacturing plant or industrial facility doesn’t require prescriptive analytics or even predictive analytics. It is about applying the appropriate coat for the right conditions. So, let’s look at each these individually.
DESCRIPTIVE ANALYTICS
Most organizations are very familiar with this category of analytics. We have been implementing these analytics ever since automation was implemented with the old relay panels. These are points of notification when some threshold value is crossed, or discrete condition has occurred. Sometimes these conditions have some time-based dead banding associated with the alert. These are your traditional alarms found in SCADA systems. e.g., a temperature value has exceeded setpoint for 60 seconds and therefore raise a high temperature alarm. This form of analytics describes what is going on in real-time. I don’t ever see a need where we will throw the concept of simple alarming out. Even when Robots rule the world, they will be notified of certain conditions based on simple notifications. This is just another coat in the closet.
DIAGNOSTIC ANALYTICS
This category of analytics could be represented by time-series data from your historian. This time-series data produces trends that can be used to troubleshoot ongoing or historical conditions. This is a slightly heavier jacket but requires more data than just a single data point in time like descriptive analytics. With time-series data, humans can find anomalies in trends and make corrections for the future. I wouldn’t throw this jacket out of my closet. But there is another new style of coat to wear here. How about something AVEVA calls Guided analytics? Guided analytics operates within AVEVA’s cloud product, Insight. Insight is a consumer of data. It can take data from any digital source and securely deposit it within its time-series database. Transferring data here has lots of advantages. First, because it is cloud-based, it can democratize access to data that once sat behind a firewall, locked away, where only a few had access. It gives access to trends, charts, data grids, dashboards, alerts, and alarms all in intuitive self-service model.
So what is Guided Analytics? Well, as mentioned earlier, one of the challenges in using AI for manufacturing is that there are so few anomalies to build a machine learning model against. Most AI models, need hundreds of failures to build an accurate model. So, what if we flip the script and not model for specific failures, but model for what normal looks like. There is a lot more data for normal. Once we have normal identified, we then can look for anything that seems abnormal to known behaviors. What if you could do this for a system like heat exchanger that has several process variables associated with it? e.g., pressure, process flow rate, coolant flow rate, temperature, amps on pumps, control valve positions, etc. What if you could model these together as a system and identify what normal behavior is? You could then alert maintenance or an operator any time that the model identifies aberrant behavior characteristics. Insight enables this wizard-based functionality. You identify the process variables, states, the time frame for the known good data and Insight does the rest. No data science team, just point and click modeling. The added benefit is that operators and maintenance teams do not have the ability to monitor assets 24×7 looking for aberrant behaviors, but the AI models can and do. This is what is meant by operationalizing the solution because this is like adding several new operators to the team.
AVEVA has recently launched an AI Vision solution that I also believe fits into this category, it is call AVEVA Vision AI Assistant. It can monitor video feeds of manufacturing systems and look for anomalies or identify discrete states. I am bullish on this technology space as I believe we will see more and more use cases for AI driven vision systems over traditional vision systems. One of the challenges with traditional vision systems, is that lighting is extremely important, and it must be consistent regardless of daytime and nighttime conditions. So, vision systems must have special enclosures that control the lighting conditions and often special cameras. This may not be always doable. AI driven vision systems can be trained with data in all light conditions and using regular cameras.
I don’t see an immediate future where Historical trending tools will no longer be necessary, but it doesn’t preclude us from layering on newer technologies that complement these tools.
PREDICTIVE ANALYTICS
Predictive analytics is incrementally harder as described above but some predictive analytics can be simple regression calculations, while others require AI to pattern historical data and develop conclusions about the future. This coat is a little heavier and requires a bit more data to be effective. So, certainly big data could be used as a tool for predictive analytics but why roll your own solution that is difficult to operationalize when there are off the shelf solutions much like a historian to give you faster and better results. Would you roll your own historian or alarming solution? Most agree no. But as I’ve been saying, analytics is like coat closets, you need more than one coat and if there is a very specific problem you are trying to solve unique to your business, then a roll your own big data solution might be the right fit for that use case.
However, once again AVEVA brings a smaller, more lightweight approach to predictive analytics through its Insight platform. The predictive analytics solution within Insight is called Advanced Analytics. It has several pre-built analytics capabilities to choose from:
• Predictive Quality
• Predictive Uptime
• Predictive Throughput
• Predictive Energy Efficiency
• Predictive Asset Reliability
• Predictive Asset Life
The source of the data that drives these models is driven from your existing historian. Even if you don’t have an AVEVA Insight subscription today, past historical data can still be used. When you purchase an Insight subscription, you have the ability to back populate your data from your traditional local historian. Once your data is in the cloud, you can have an analytics model trained and deployed in an hour.
But as mentioned above, the data requirement still exists. Machine learning models need data regardless of the solution technology stack. In particular, predictive models need to have lots of sample data to train on. Most of these models require 100-200 example events within a 6-to-18-month period depending on the analytics capability. So, this is going to be one of the biggest considerations, because as I led with earlier, manufacturers try not to have these anomalous events in large quantities and there may be a question of whether sufficient data exists.
PRESCRIPTIVE ANALYTICS
Prescriptive analytics is the heaviest coat of all. Instead of predicting quality, what if I could tell you how to prevent having a quality incident all together. What if there was way to ingest the data across your connected manufacturing centers and build a simulated model of your process that could react to current ambient conditions, raw material consistency and finished product sku and then define what your center lined machine settings should be for a particular run to get better quality output, higher energy efficiency or the most throughput. What I am describing is what I would refer to as a data digital twin. We are not talking about visual simulation and modeling but modeling the system inputs and subsequent outputs and their correlations to one another. This digital twin tries to understand how changing one parameter hours earlier in a process could affect a machine’s throughput or quality consistency at the end of the manufacturing run.
To accomplish this requires very large data sets from many different sources. As we climb the ladder of analytics, each layer becomes progressively harder. The need for massive amounts of data is ever increasing and once you reach prescriptive, it is a really hungry beast. However, if you can pull it off the rewards can be great. InSource Solutions’ partner product, Braincube, focuses on creating dynamic digital twins used to uncover root cause, identify, and prevent defects, optimize processes, evolve predictive maintenance strategies, and more. It can consume data from many data sources, contextualize it, account for any time lag, and then provide prescriptive guidance on how to best optimize your processes.
SUMMARY
Just as we dress in layers and choose the right coat for the day, manufacturers need to have more than one analytics tool at their disposal. We can all deploy Smart Data solutions that are quick to deploy and scalable across the enterprise. Solutions that enable non-data scientists to leverage modern machine learning technology and help prevent the next outage. But depending on the environment, your team may also need access to more sophisticated tools that might be more complicated to deploy, but also solve bigger and more high value problems. Let’s not leave our Engineering, Operations and IT teams with only one coat in their closets.