MES and Connected Workers. The Next Gamechanger.

Part 1 in a series on Adoption Tips & Tricks.
The Manufacturing Execution System (MES) umbrella of functions is quite broad and the benefits in productivity, efficiency, as well as personnel connectivity across a line, plant, or supply chain, are often documented and celebrated. But the real value of an MES system is in ensuring things get done correctly.
Examples of “correctly” include ensuring production orders utilize the correct recipe and are posted with all relevant data, capturing lot #’s and details of what is being produced, recording equipment downtime events and durations, capturing run rates against the product, and driving the collection of quality samples. These are beneficial because they can drive and enforce a quality standard manufacturing process. In short, MES collects valuable data in context to the product or even shift. The lifeblood of what, how, and when a manufacturing process or activity happened is the primary focus. So, at the end of the day everyone knows the answer to, “did we get done what we needed to today?” This view of your performance can be a gamechanger, particularly in situations where manufacturing execution systems are newly digitized or where a prior implementation was upgraded to fix the availability or reliability of the production data.
However, the NEXT gamechanger is even more impactful and is often overlooked. Giving ready, mobile access to a digitally transformed manufacturing process is powerful. In order to take organizations to new levels of productivity and efficiency, project implementers must ensure actionable context. The available data must answer the question, “Why?” Consider the following interaction:
Kyle (Production Manager): “Darla, we’re really liking the new MES dashboards and being able to see what’s going on across the lines. The real time awareness is increasing our ability to respond.”
Darla (Digital Transformation Team Lead): “Glad you are finding it helpful. Have you been able to drive measurable improvements?”
Kyle: “I’m sure we have; our overall plant performance has definitely improved!”
Darla: “That’s great, are there any good use cases you can point out? That would be really helpful as we start to roll out the MES system and engage teams at our other sites.”
Kyle: “Nothing specific. The dashboards show the downtime and production events & durations at the station level. That’s exciting because we haven’t had confidence in that type of information in the past. I’m not hearing doubt anymore. But, we can’t see why a particular event happened or really do much analysis over time. I’m sure it’s helping,……..but I suppose we could do a lot more to prevent issues if we had an easy way to know why they were happening.”
Darla to herself: Hmmm, might be an opportunity here……
So, in the simple exchange above, you can see that the MES deployment was successful. It is technically functioning and presenting valuable information to staff. The plant has good engagement, for now, with the system and resulting data. Yet, Kyle has pointed out the key element that often gets overlooked: The “why” an event or issue happened.
For performance-related data like downtime, speeds/rates, and quality the what, how, and when are very helpful. As illustrated above, Kyle and his team are realizing benefit from visualization and general awareness in near real time on how they are doing. It’s helping focus improvement of his team’s routine/response activities. However, in order for performance improvement and loss prevention efforts to continue, the why is needed for people to act.
Don’t get me wrong, being aware that a particular piece of equipment was down 42 times last shift and that we lost 22% of its expected runtime provides awareness that there is a problem. And it can bring focus where it did not exist before. Yet, other than putting it on a histogram and knowing we should pay attention to it, there’s not much more the data can tell us.
Adding “the why” to a stop condition transforms a downtime chart (Exhibit 1):
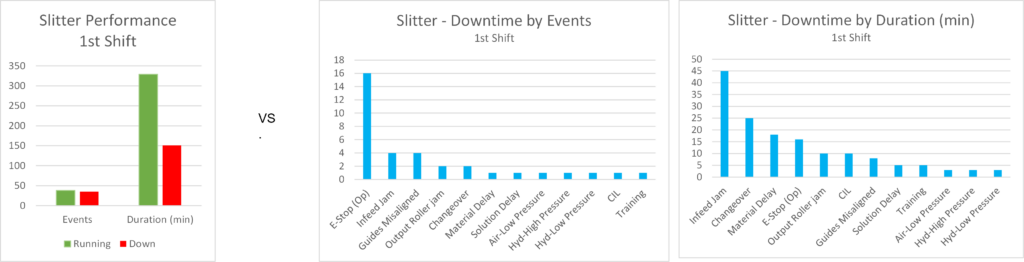
Exhibit 1
The first chart is helpful if the team never had anything more reliable. In this case they may be able to compare it to other pieces of equipment and focus gathering more data on the highest offender. But, look at what adding just one level of attribution reveals. For example, knowing the e-stop is being tripped by the operator vs jams that are caused by an equipment issue drives entirely different follow-up actions. This richer MES “why” dataset gives teams the context they need to put meaningful action plans in place.
So why wouldn’t everyone add the “why” context? The most common challenges we hear are:
- “We don’t have that level of automation available to detect and categorize it automatically.”
- “We don’t want to distract our associates with having to enter a category and they’ll likely be inaccurate.”
Those problems are very solvable. In fact, I’ll take on that topic in my next blog. In the meantime, I’ll leave you with this…go back to the interchange above between Kyle and Darla and consider how much opportunity for improvement is being missed? What if our front-line folks were not just connected to helpful data, but were permanently enabled by that data to perform and lead at a higher level? Gamechanger.